
Turning Data Into Information Using ArcGIS
Module 2: Cartography, Map Production, and Geovisualization
Problem
The exercise objectives are to explore different scales, extents, and ArcMap customizations. The first problem is to categorize and symbolize data to enhance a map’s quality. The second problem involves generalizing a coastline. The last problem in this module requires one to select certain vector features by both attributes and location.
Analysis Procedures
Data of major attractions, climate, cities, roads, colleges, etc. were added to the ArcMap table of contents. To explore scales and find features within ArcMap, zoom functions, the Find button, and the table of contents were all used. To categorize data, city boundary and road layers in the table of contents showed all features with a single symbol. To distinguish the polygons and lines from one another, categories were provided in the Layer Properties dialog box where all unique values were added and symbolized. The ArcInfo cartography Simplify Line tool was used for generalizing a coastline feature. This resulted in a new simplified coastline layer. For the last problem in this module, a school was selected by name from the colleges layer and then all city attractions, railroads and hospitals were queried by location to within one mile of the school.
Results
Below are screen captures of some of the exercise results.
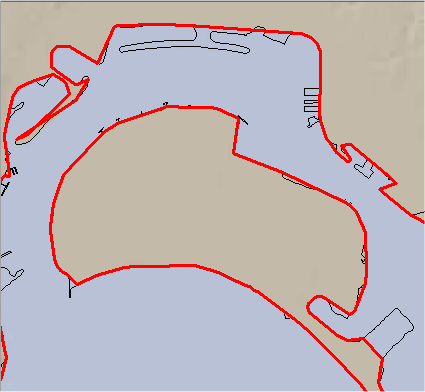
A coastline has been simplified (Red) through the use of an ArcInfo cartographic tool.
City attractions (Purple stars) that are within 1 mile of a certain school.
Application and Reflection
The results of the exercises in Module 2 taught what scales allow the appropriate level of detail. The purpose of scientific visualization is important for exploring, interpreting, and validating data. In general, these exercises demonstrated cartographic skills that can aid in all map production.