
Working with U. S. Census Data
Learning Objective
Develop the ability to independently locate, filter, link and map U. S. Census Bureau data from American Fact Finder and TIGER/Line shapefiles.
Problem
Develop a thematic map for one attribute of your choice from a US Census dataset for the geography of your choice.
Analysis Procedures
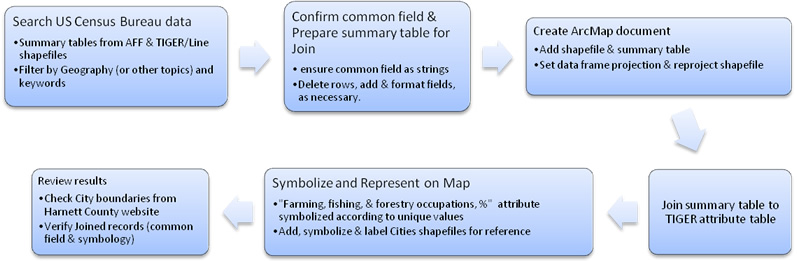
The decision was made to develop a map ranking census tracts for Harnett County, NC according to the percentage of farmers, fishermen and foresters by occupation (NAICS Sector 11) within the county. Using the American Fact Finder (AFF) from the U. S. Census Bureau website, the ”Geographies” search option was chosen. The selection was narrowed down to Harnett County, NC. Keywords of “industry” and “census tract” were used as further filters using the Search box to arrive at summary files (SF) 3 and 4 for year 2000 data. Summary file 3 for table GCT-P13: Occupation, Industry, and Class of Worker of Employed Civilians 16 yrs. and over by census tract was selected and downloaded from the Table View tab in an Excel format option. (The ZIP file was also downloaded in order to view any accompanying README files.) Information about the data provides for a grouping of six occupations and the percentage distribution of each employed civilian age 16 and over. The table does not provide employment numbers. For this exercise, the attribute of interest is the percentage of farmers, fishermen, and foresters. TIGER/Line census tract files were sought for the county. The 2000 TIGER/Line shapefile for Harnett County was found and downloaded from the US Census Bureau website. Its attribute table was viewed in ArcMap for a field containing census tract numbers as strings. The census tract shapefile was reprojected to the NC State Plane, NAD83 coordinate system with linear units of feet. The SF3 table was prepared for use in joining to the shapefile’s attribute table. This summary table was added to the ArcMap document and joined to the census tracts attribute table, then symbolized for map creation. The map represents the distribution of agricultural and forestry occupations within Harnett County according to census tract. City shapefiles were downloaded from the Harnett County Spatial Data Explorer website and added to the map for visual reference. The flowchart below illustrates the methods described above.
Results
The map below depicts the results of using American Fact Finder (AFF) occupational summary data with TIGER/Line census tract shapefiles.
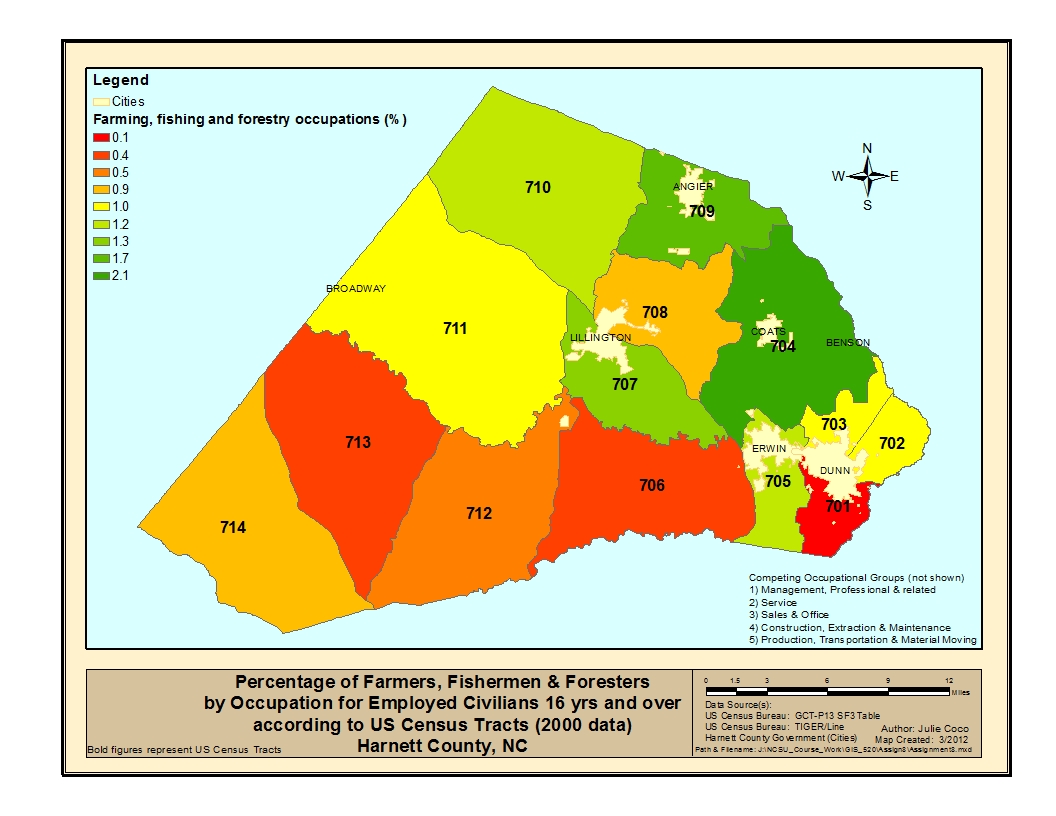
Click image to enlarge.
Application and Reflection
US Census Bureau statistics can be used for a number of applications. Business patterns, employment and income, median age, median home values, and education attainment are examples of statistics that can be spatially represented and used to market a particular business or industry for example, or to determine where to live. Occupation data could be used to determine the likelihood of obtaining a job relevant to your field in a particular region of interest. Commuting data can be used to determine both the dominant mode of travel to work and the mean travel time from within your region of interest. Combined with spatial data, a map of commute mode and time could affect your decision on where to buy a home.