
Image Classification
Learning Objective
To demonstrate an elementary understanding of image classification
Problem
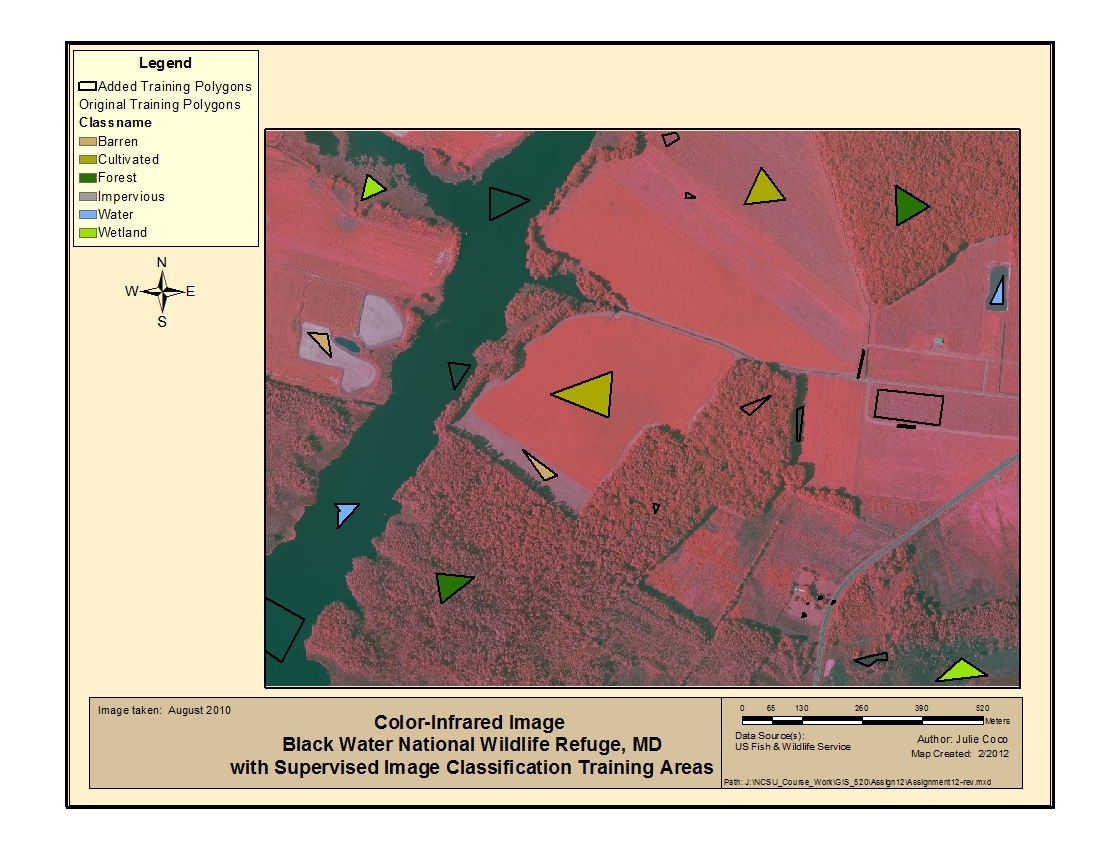
The problem requires performing a supervised classification on an aerial photograph from the Black Water National Wildlife Refuge. The aerial photograph is a 4-band (true-color and color-infrared) 1-foot resolution image flown August 2010. It contains six main land cover classes: Forest, Cultivated Field, Barren Area, Developed/Impervious, Wetland and Water.
Analysis Procedures
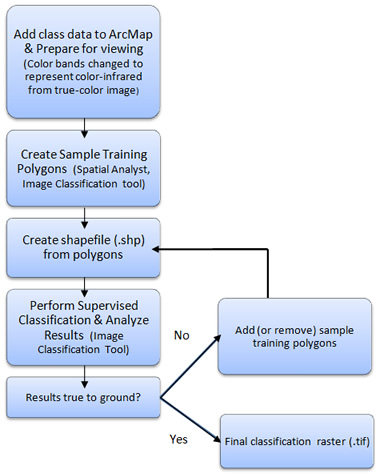
The color-infrared version of the TIFF image was manipulated and classified within ArcMap using new functions in ArcGIS, version 10 software. In order to make use of the color-infrared band (Band 4), the image bands were first changed to Red: Band 4, Green: Band 3, and Blue: Band 2. A supervised classification was then performed twice using the Spatial Analyst, Image Classification toolbar. The first run entailed creating two sample training polygons per land cover class, saving the polygons as a shapefile, if necessary, running the classification, and comparing it visually to the color-infrared photograph. Care was taken to ensure all cells in the polygons had similar values by which to classify as they were being created. This was accomplished by zooming in to fairly uniform areas and drawing smaller polygons. The second run entailed adding sample polygons from the areas not properly classified from the first run, and reclassifying. The Sample Training Manager within the Image Classification tool allowed for training polygons to be color coded, merged (if desired), named, and saved as a shapefile (click here for a map of the image with training samples). Once the training samples were created and the supervised classifications run, the resulting raster TIFF was visually compared to the color-infrared photograph and/or previous runs. Improvements to the classification process involved redefining the sample set on a somewhat trial-and-error basis. Below is a flowchart of the classification process.
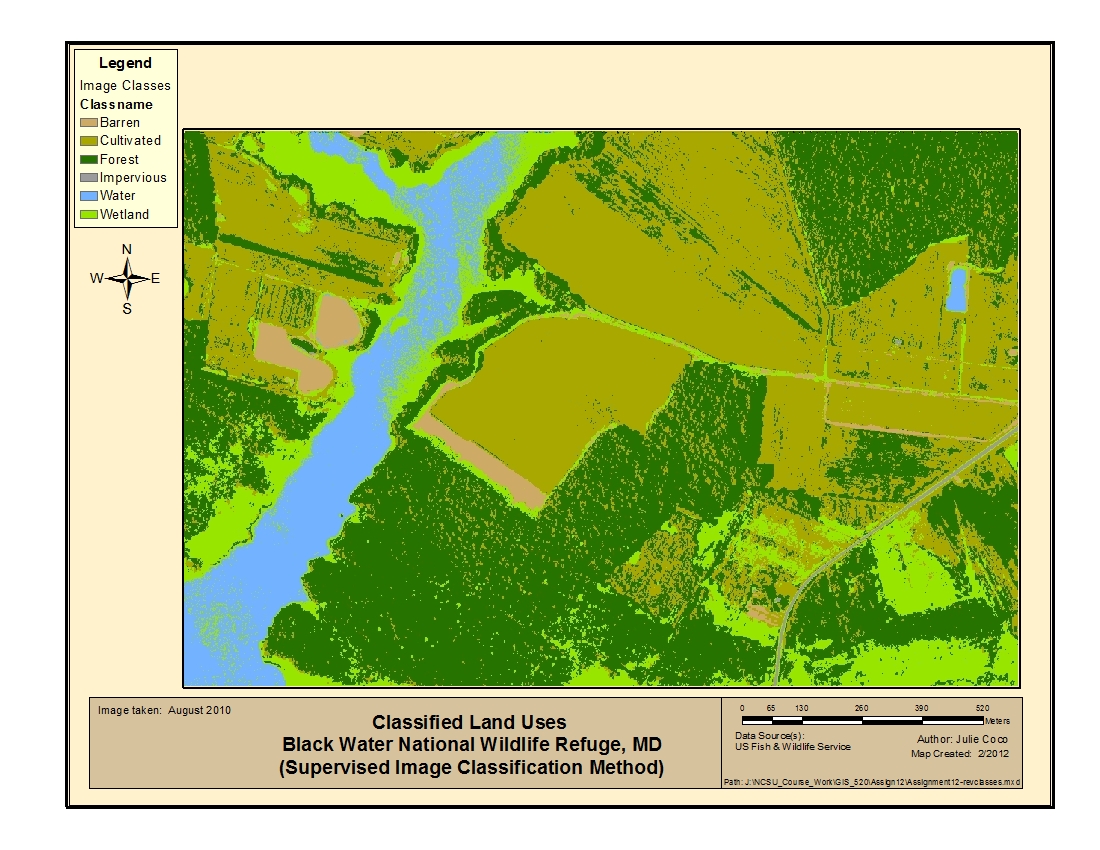
Results
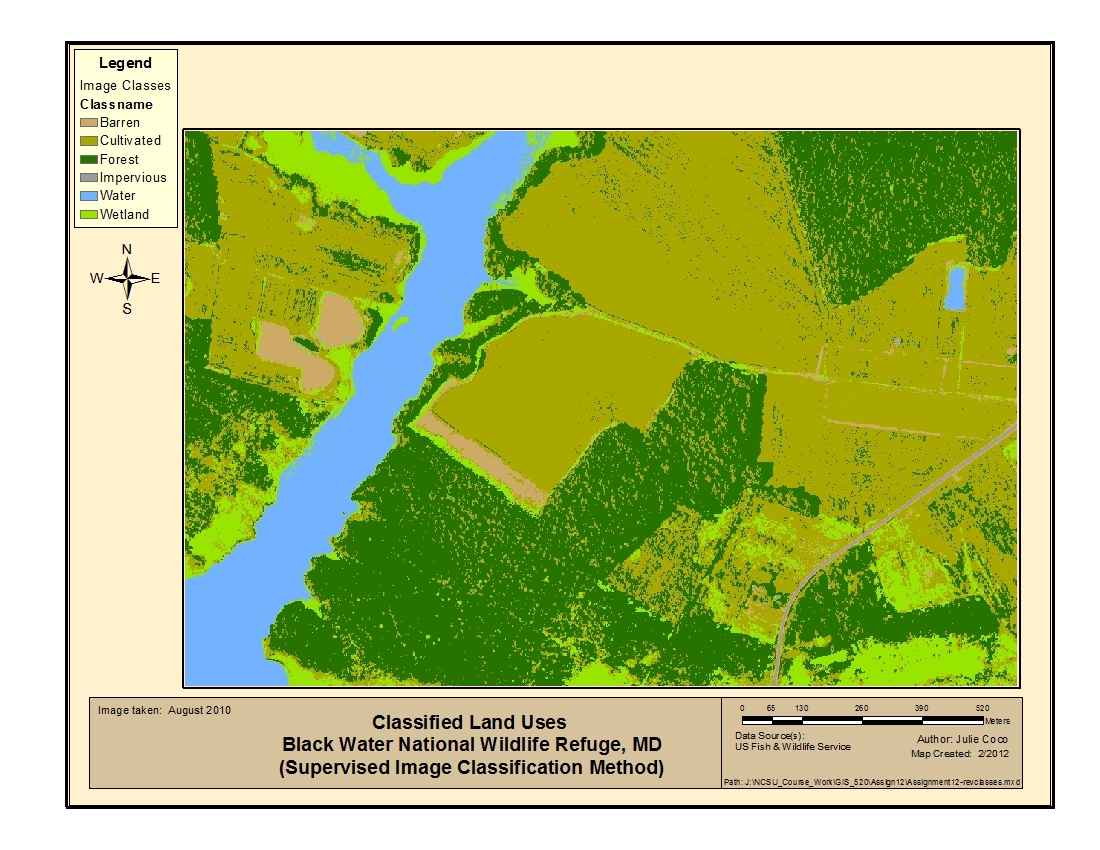
The maps below show the results of a supervised image classification. In the top map, two sample polygons (training classes) were drawn per land use class in order to perform the automated classification process. Note areas of dilution between land use classes. With additional polygons, the land use classification results in the lower map are better defined in this case, as well as true to what was observed from the aerial image.
Click images to enlarge.
Application and Reflection
Classifications of raster images can be used for a multitude of identification purposes. Land classifications are used to aide in defining coastlines, wetlands, vegetation types and health, and mineral compositions of the underlying earth, to name a few. Determining impervious surface area, as performed in this exercise, can be used to estimate runoff for peak flow computations.