
Spatial Statistics
Learning Objective
To demonstrate an elementary understanding of statistical spatial data analyses
Problem
This exercise involves analyzing spatial patterns in 2007 service calls for the Fort Worth, Texas Fire Department. Specifically, they want to know if false alarm calls tend to cluster together within their battalion (Battalion 2). If so, the department will target its safety campaign to those areas. They also want to know if calls ranked as a high priority tend to cluster in certain areas of the battalion, as well as the significance of this clustering. Finally, the fire department is looking at the density of calls per neighborhood block and would like to see at what distance these densities cluster. All of these analyses would help in locating future stations.
Analysis Procedures
To answer these questions, the following statistical analyses was performed:
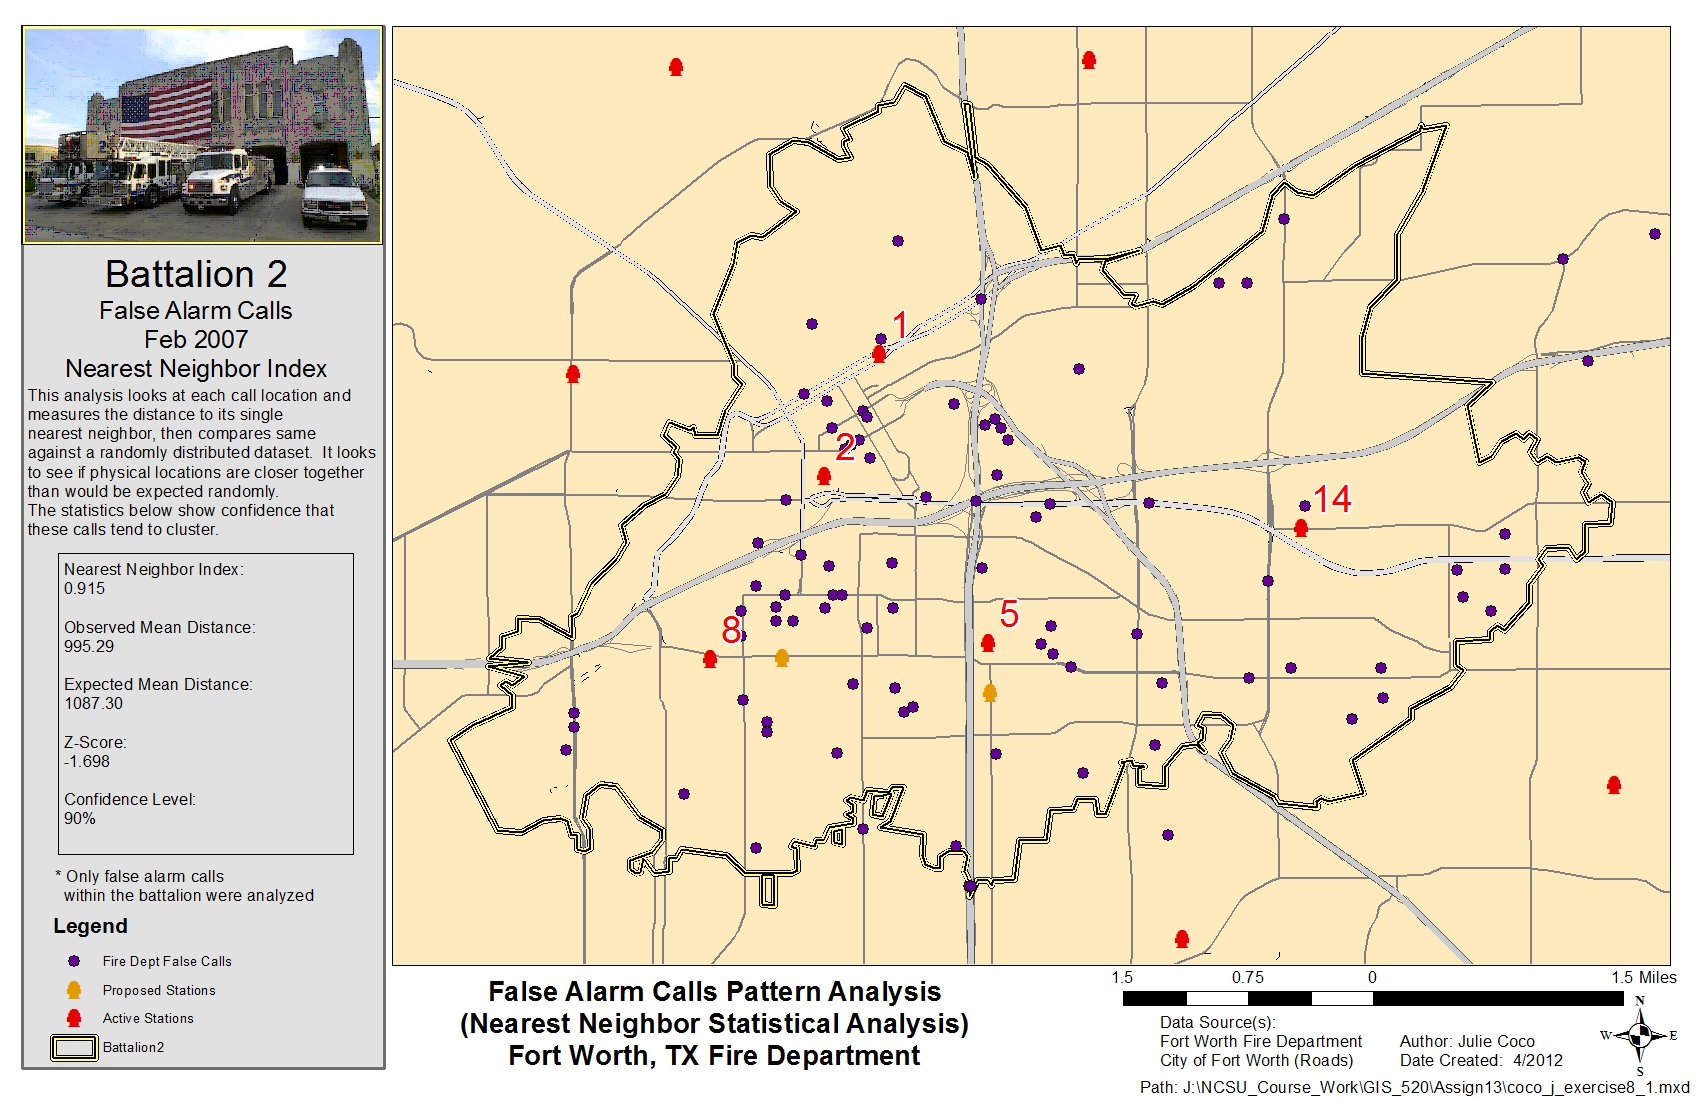
1) Average Nearest Neighbor (clustering by location) – used to determine whether or not false alarm calls tend to cluster, or are simply randomly distributed within the service area.
2) Getis-Ord General G (clustering by value) – Calls of similar priority are used to determine if they have a tendency to cluster together, whether they are of high or low priority.
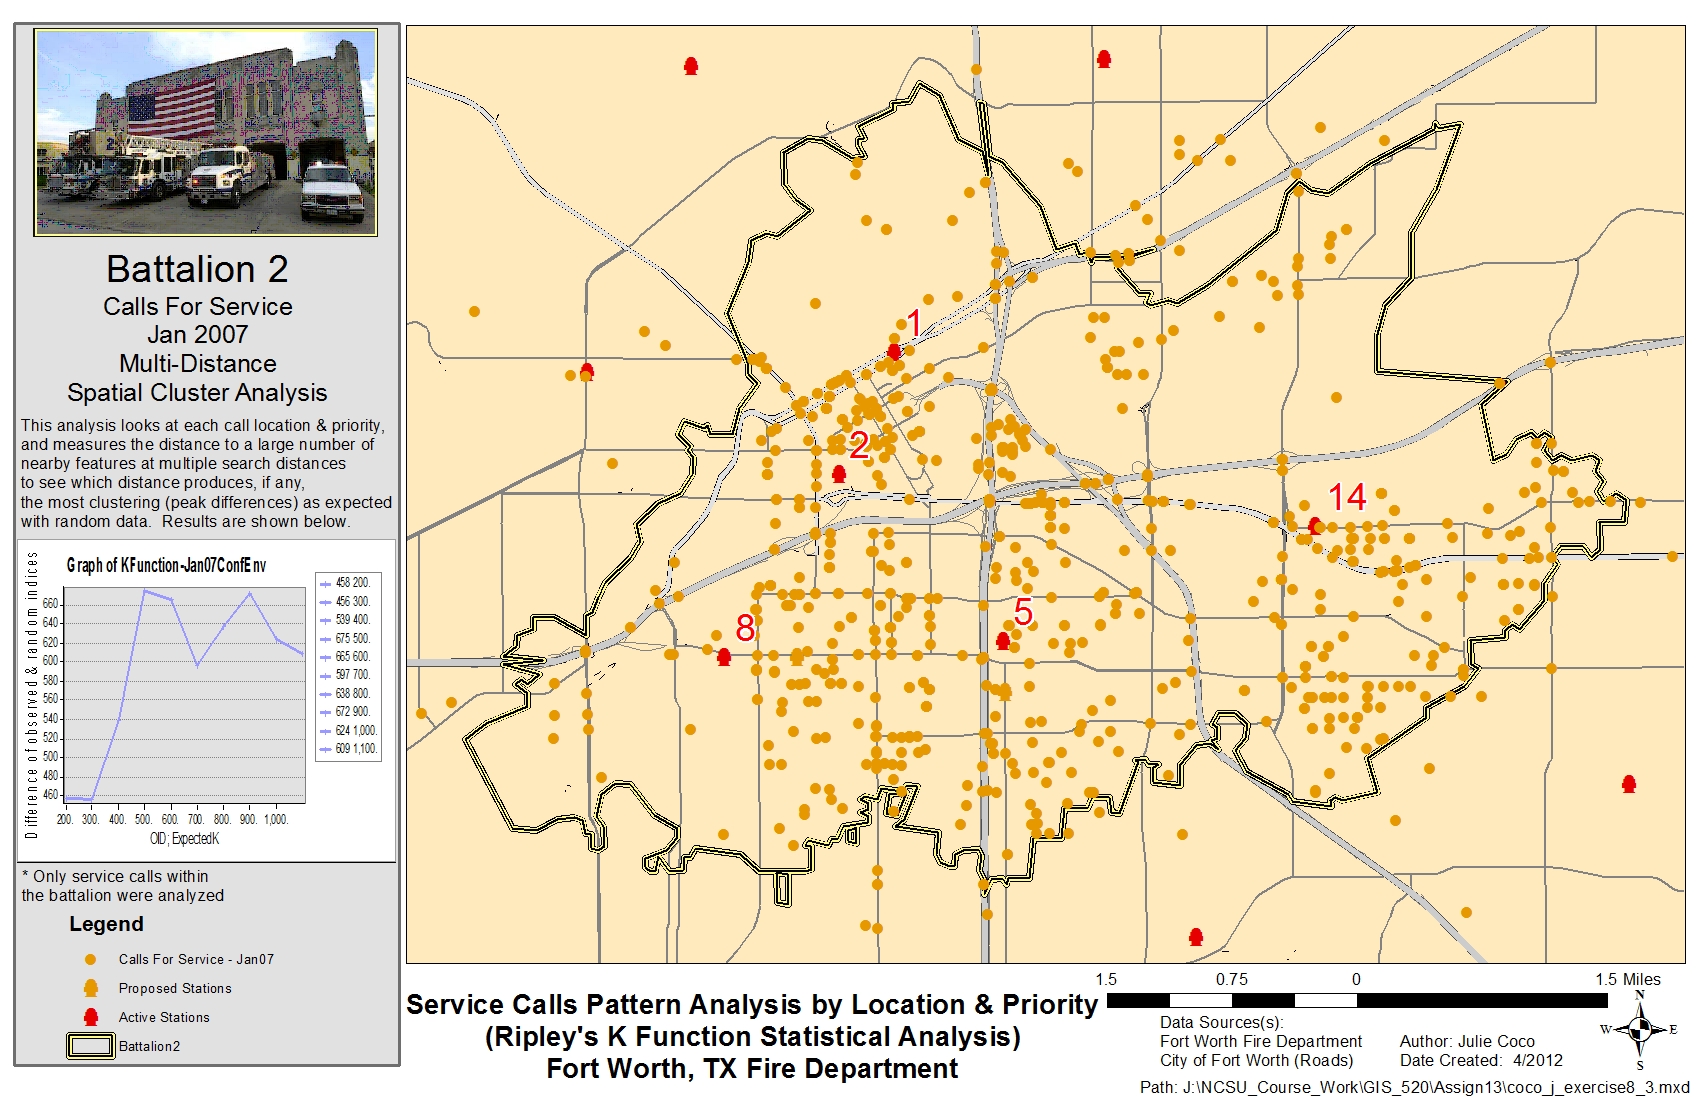
3) Ripley’s K Function (clustering by location using multi-distances) – If clustering of service calls exist, this analysis will be used to determine the most significant clustering based upon the relationship of each feature to all other features, and upon the call priority. To accomplish this, multiple search band distances will be run.
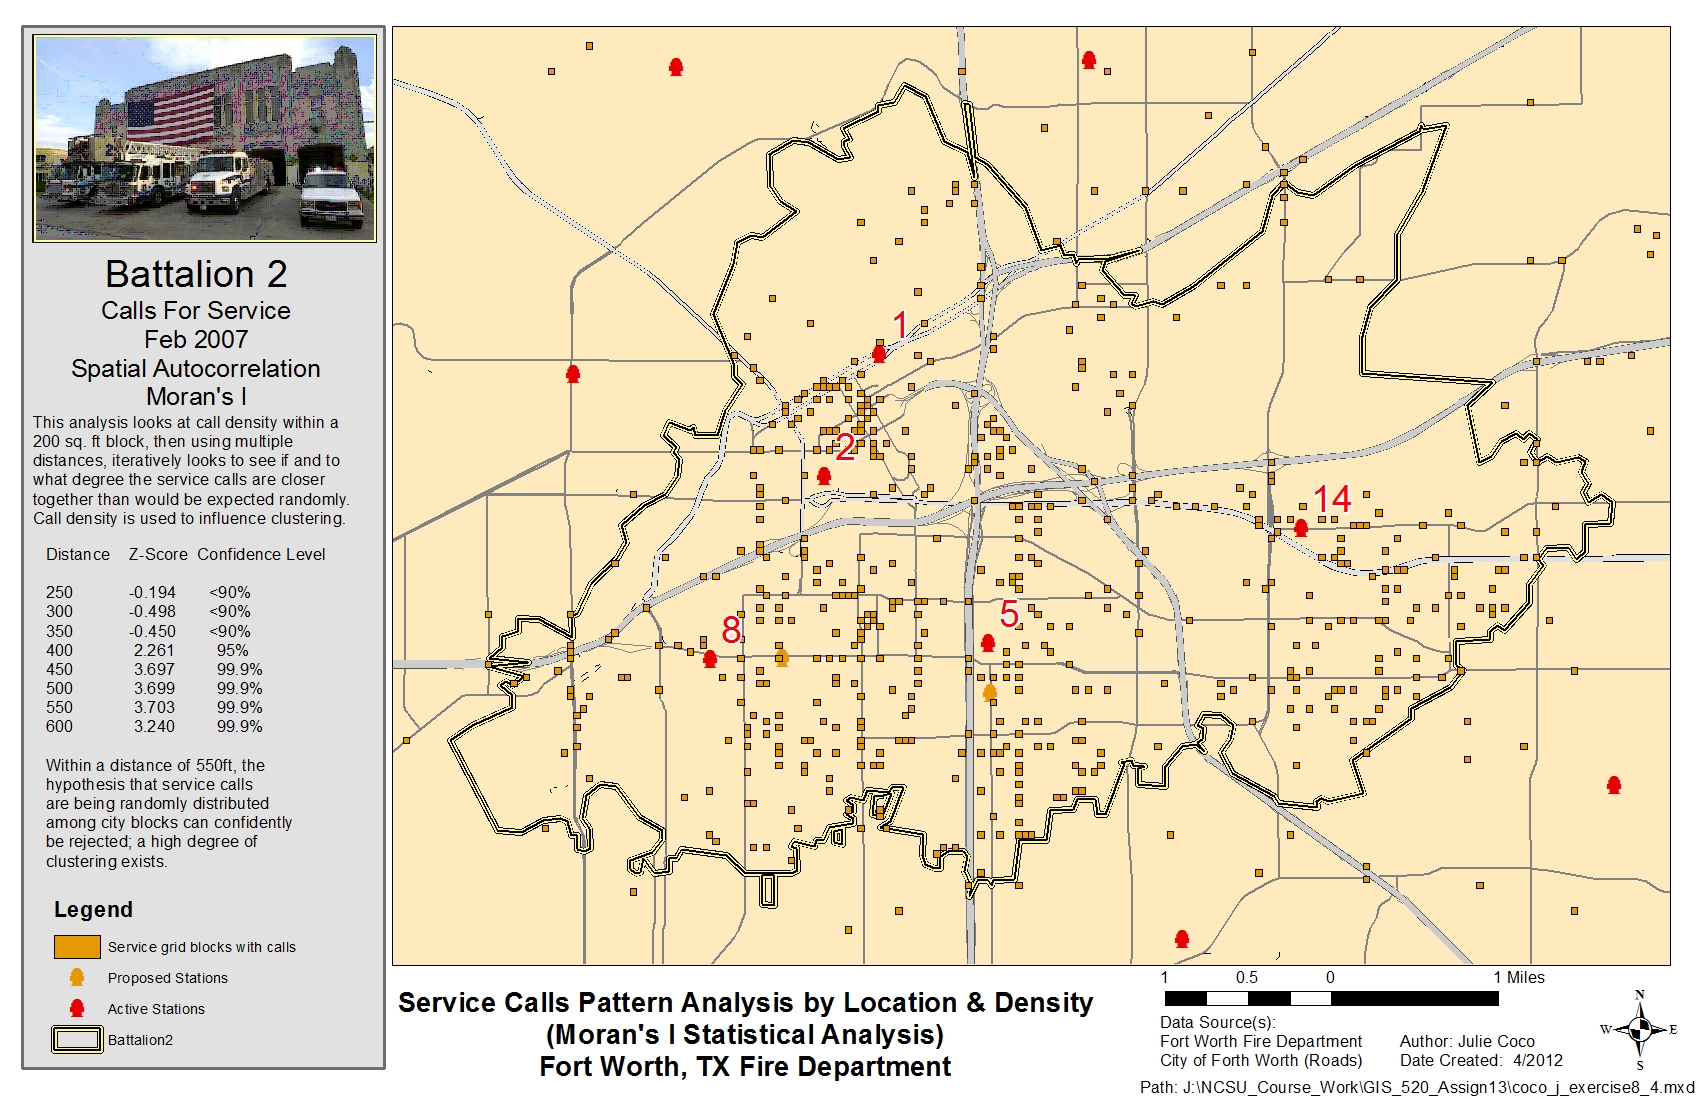
4) Global Moran’s I or Spatial Autocorrelation (clustering by location and similar value) – Calculates the density of calls for areas of 200 sq. ft. in order to see if and how densities cluster.
Solving spatial statistics problems by analyzing patterns involves forming a null hypothesis and testing it for rejection to some degree of confidence. The results of the analyses use Z-scores (standard deviations) and p-values (probabilities) to determine whether incident data is clustered, dispersed, or purely random. The data to be used for solving the above problems involves calls for service during January and February of 2007. This data was provided by the Fort Worth Fire Department, and includes incident values representing the types of service calls. A boundary layer for the Battalion 2 service area was provided. ArcGIS v.10 software was used with spatial statistics tools for all analyses. For the Average Nearest Neighbor analysis, this data was queried for false alarm calls within the battalion service area before using the spatial statistics tool inside ArcToolbox. The result indicated false alarm service calls were closer together than would be expected with just a random distribution.
For the Getis-Ord General G analysis, a distance band was calculated from the neighborhood count Utility tool in ArcToolbox. The input number of neighbors was estimated. This average critical distance was then used in the Spatial Statistics, High/Low Clustering tool to determine clustering by call priority. The tool was run multiple times, increasing the threshold distance incrementally, to obtain the highest Z-score as representing the strongest clustering. The results showed less than a 1% chance that service calls ranked as high priority were randomly distributed. Thus, the null hypothesis that priority ranked calls are randomly distributed across the battalion could be refuted.
Since clustering of the data does appear to exist, the Ripley’s K function was used to look at the distance, not only to the nearest neighbor, but to all other nearby neighboring features to determine a clustering index. Like the General G analysis, multiple runs were performed for 10 distance bands using a starting distance from the high/low clustering tool (200 ft) and incrementing the analysis by increasing the size of each band, or ring, by 100 feet. Using the call priority ranking as a weight influences the results. The Boundary Correction Method was set to None, since features exist outside the study area that can be used in the measurements. The Study Area Method selected used the Minimum Enclosing Rectangle option. This analysis was run using a confidence envelope. Ninety-nine permutations were selected as the option for this envelope to be created in order to check a larger sample of the random data. From this, a table of results including K indices was added to the ArcMap table of contents. A field was added to the table to find the difference between the observed K indices and the upper limit of the confidence envelope. A graph was then created showing each difference on the Y-axis versus the expected K values on the X-axis. The highest peak from this graph represents the point of most clustering.
The Ripley’s K Function, or multi-distance clustering, is a refined method of clustering by location. As with the Average Nearest Neighbor method, the results indicate a high degree of clustering, but at a distance of approximately 500 feet.
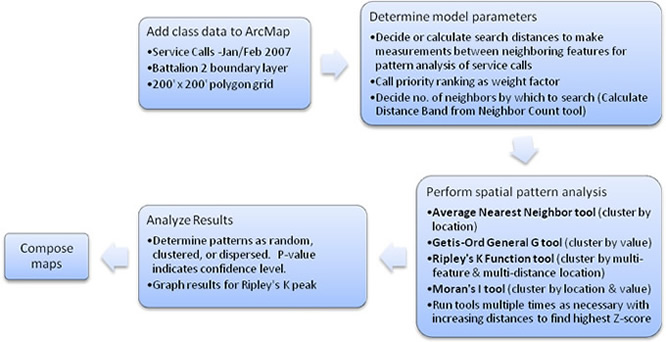
To calculate the density of service calls for the Global Moran’s I analysis, polygons or a grid must be created and spatially joined with the data. To address Battalion 2’s concern, a 200 x 200 ft grid was created, joined, and queried for grid blocks with at least one service call. The Spatial Statistics, Spatial Autocorrelation tool was run with this grid as the input feature class and input field being the (call) count. The tool was run multiple times with distance bands similar to previous runs. The greatest standard deviation (Z-score) was recorded. The results showed a high likelihood that density clustering also exists. The flowchart below depicts the general process for analyzing statistical patterns.
Results
The maps below illustrate service call locations and provide statistical results for the Average Nearest Neighbor, Getis-Ord General G, Ripley's K Function, and Global Moran's I (Spatial Autocorrelation) pattern analyses, respectively. Click on the images to enlarge.

Application and Reflection
A florist might use the nearest neighbor index to determine the clustering of customers. This would identify those customers closer to each other than by chance, and possibly target these areas for deliveries. That same florist may use the General G statistic to determine the clustering of customers with the highest dollar amount of purchases in order to target these areas, or he/she may use multi-distance clustering to find customers on a more regional level for expanding the business. Analysis of statistical patterns may also give more credibility to density maps, and when used with Mapping Clusters tools, can provide better symbolized classifications.