
The Basics of Working with Raster Data
Learning Objectives
- To understand the basics of raster data by completing the ESRI tutorial, "Basics of Raster Data (for ArcGIS 10)"
- To learn to use raster data for site suitability analyses by completing the ESRI tutorial, "Using Raster Data for Site Selection (for ArcGIS 10)"
Problem
This exercise involves using raster data for site selection, otherwise called suitability analysis. It is a form of GIS analysis used to determine the best place (site) for something, such as a new store, landfill, school, vineyard, or the location of plant or animal habitats. Two ESRI tutorials were selected for students to complete in order to understand and perform suitability analyses. These are 1) The Basics of Raster Data and 2) Using Raster Data for Site Selection (for ArcGIS 10). There are three types of suitability analyses: binary, weighted suitability, and fuzzy logic. The problems in this latter tutorial involved performing a weighted suitability analysis for selecting an optimal site for a vineyard, and a fuzzy logic analysis for modeling bald eagle habitat.
Analysis Procedures
Weighted site selection involves taking multiple rasters, ranking their cell values based upon a common scale and assigning a relative importance (weight) to each layer in the analysis. A combined raster will result in a surface with varying degrees of suitability. In other words, the analysis results will include next-best site options.
Fuzzy logic assigns membership values to locations. Values range from 0 to 1: 0 indicates non-membership (or unsuitable), and 1 indicates full membership (or suitable). This type of analysis helps you determine if a raster cell is part of a set. The set represents the ideal condition specified by the analysis criteria. Fuzzy membership values indicate possibility. (This is not the same as probability.) Fuzzy logic is best suited for analyzing data that doesn't adhere to discrete polygons and boundaries, and for overlay analyses that account for potential inaccuracies in data.
For both site selection problems, ESRI provided rasters such as elevation, freeways, solar radiance, water bodies, and land cover were used in the tutorial to determine distances from, and factors such as slope and favorable habitat. Weighted suitability analyses, or site selection often requires the use of the ArcGIS Spatial Analyst, Reclassify and Weighted Overlay tools. The Reclassify tool was used to rank cell values to a common scale so that all rasters can be combined and weighed. In siting a vineyard, input rasters were assigned a scale of 1 – 5, with 1 being the least suitable and 5 being the most suitable. The Weighted Overlay tool combined all input rasters and ranked their importance so that the resulting raster displayed optimal sites as well as next-best site options. For instance, solar radiance (the vineyard’s exposure to sunlight) was ranked higher than its location, or distance to freeways.
Fuzzy logic used for site selection requires the use of the ArcGIS Spatial Analyst, Fuzzy Membership and Fuzzy Overlay tools. Fuzzy membership values range from 0 to 1, with 0 being not likely suitable and 1 being most likely suitable. Membership types can be linear or non-linear relationships, whereby high fuzzy membership values are assigned to small, large, or mid-range values, for instance. The membership assigned to the lake when creating the “fuzzy water distance layer” was Small. The Small membership type indicates that smaller values in the input raster have high membership in the fuzzy set. For example, a smaller distance to water was assigned a fuzzy set value closer to 1 and a larger distance to water will be closer to zero. The Fuzzy Overlay tool, much like the weighted overlay tool, combines the results from the fuzzy membership layers in accordance with certain operators. For instance, overlay types include finding suitable locations that meet all of the criteria, any of the criteria, or the most suitable criteria using combined fuzzy membership input values. In the bald eagle habitat analysis, the fuzzy water and fuzzy human disturbance rasters were overlaid such that all criteria had to be met before continuing the overlay with the product of its result and the tree cover/habitat to determine the most suitable locations.
Results
The image below shows the results of the weighted overlay analysis. The areas in green indicate optimal sites for a vineyard in California. Red areas indicate the least suitable sites for a vineyard. All other colors represent next-best site options.
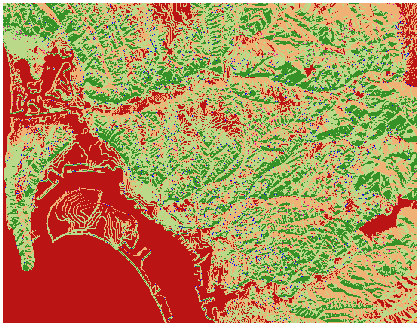
The image below shows the results of the fuzzy logic analysis. The areas in green indicate optimal sites for bald eagle habitat around Big Bear Lake in California. Red areas indicate the least suitable sites for eagle habitat. Likewise, areas in yellow represent moderately suitable sites.
Application and Reflection
As indicated in the problem statement, suitability analyses can be used to aid in locating schools and landfills, among other sites. Weighted suitability analyses are when next-best site options are to be considered and when there is a level of certainty in the data, such as discrete boundaries. An example includes site locations for a new agricultural field based on land use/zoning, slope, and soil types. Fuzzy logic analyses are used to model complex phenomena that cannot be modeled using discrete variables. It is best for modeling wildlife habitat, for instance, where migration patterns may not follow discrete boundaries. Fuzzy logic may also be used to analyze stream bank failures, or in other words, when there is some uncertainty in the data.