
Suitability Analysis & Weighted Overlay
Learning Objective
To demonstrate an elementary understanding of Spatial Analysis including Suitability Analysis, the Weighted Overlay Function, and Model Builder
Problem
Biologists at the Great Smoky Mountains National Park are having problems with certain black bears. The problems occur when park visitors and bears interact. The problems seem to be concentrated around roads and trails throughout the park. Even though biologists capture these bears and relocate them to other areas of the park they seem to return. Biologists want to know if there are areas in the park that would provide the basic needs for bears that would not lead to any interactions.
Research has shown that bears are more likely to frequent areas greater than 1 mile from roads and trails, less likely to frequent areas within 0.5-1 mile of these features and unlikely to frequent areas within 0-0.5 miles of these features. They are also more likely to frequent areas within 0-0.5 miles of streams, less likely to frequent areas 0.5-1 miles from streams, and unlikely to frequent areas further than 1 mile. Bears highly prefer grape thickets and secondarily, are prone to visit cove hardwoods, mixed mesic hardwoods, and northern hardwoods. Finally, they tend to stay on slopes of 0-30 degrees, less likely to climb slopes of 30-60 degrees, but unlikely to climb slopes greater than 60 degrees.
Analysis Procedures
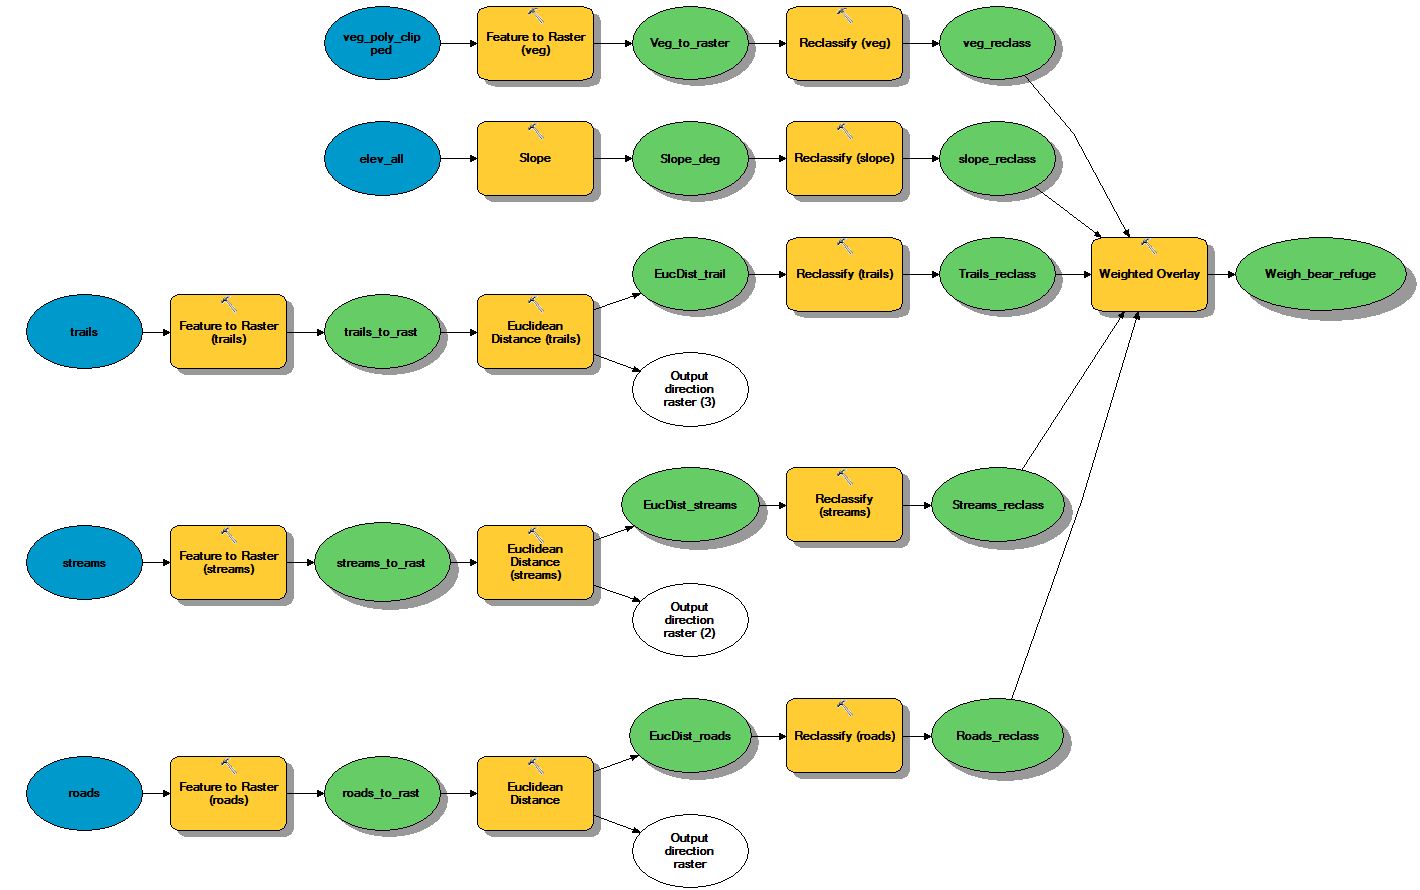
Because the solution to this problem requires many data layers and processes, a model was developed within ArcGIS software. To create a model, a toolbox was first created in ArcCatalog, and added in ArcToolbox. While in ArcToolbox, the environment settings were adjusted such that the output extent for all analyses was set to the vegetation layer. This layer had been previously clipped to the national park borders. The output cell size was set to 30 meters. The first data added in creating the model was the elevation raster. Using the slope tool, an output slope raster was computed in units of degrees. The reclassify tool was added to the model. Using the research information, vector and raster data of roads, streams, trails, vegetation and elevations were prepared and reclassified on a scale of 1-3 with “1” being the least favorable and “3” being the most favorable habitat for the black bear population within the park. Next, the trail feature layer was added to the model. Adding and connecting to the Euclidean Distance tool allowed for an output raster showing the distance for each cell from a trail. The distances were then reclassified into three classes according to the criteria mentioned above by adding the Reclassify Tool to the model. A similar process was used for both the roads and streams data. Finally, the vegetation feature layer was added to the model. It was converted to a raster by adding and connecting to the Feature to Raster tool to the model, and then reclassified according to unique values when adding the Reclassify Tool. Cove hardwoods, mixed mesic hardwoods, and northern hardwoods were given a value of “2”, grape thickets were given a value of “3”, while all other vegetation classes were given a value of “1”.
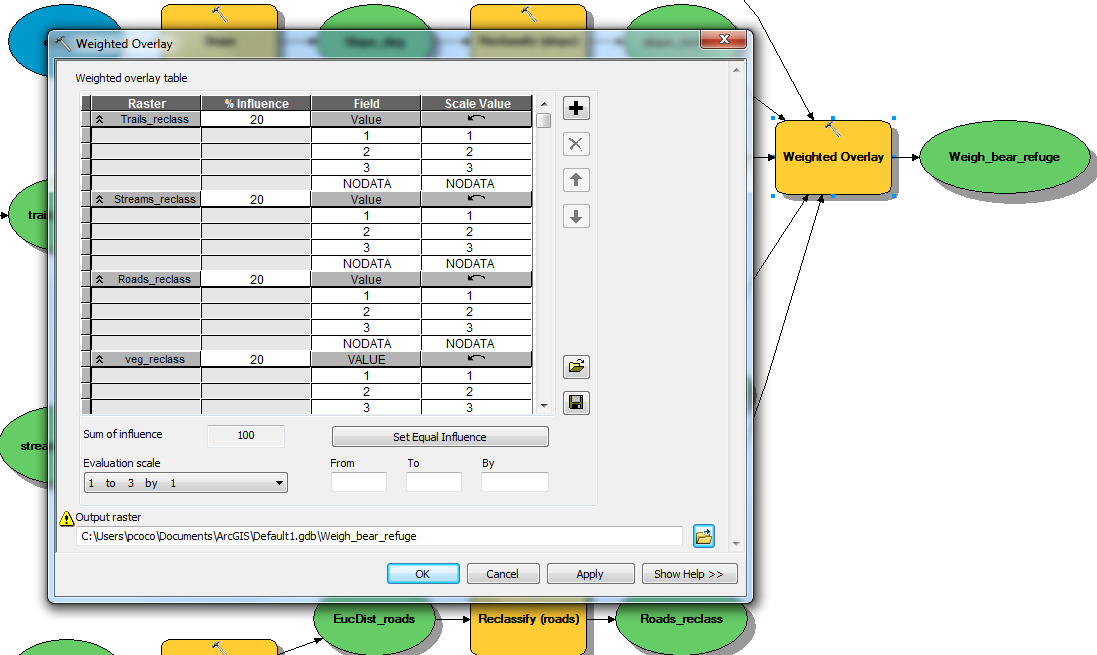
The Weighted Overlay tool was added to the model. The resulting five reclassified layers were used as input to this tool and given an equal weight in the analysis (click here for a snapshot of the partial parameters for this tool). The final result was a graduated color raster showing areas least favorable, somewhat favorable, and most favorable black bear habitats. Below is the weighted overlay process as shown in Model Builder.
Click model to enlarge.
Results
The map below shows those areas within the park that may be more suitable for relocating black bears.
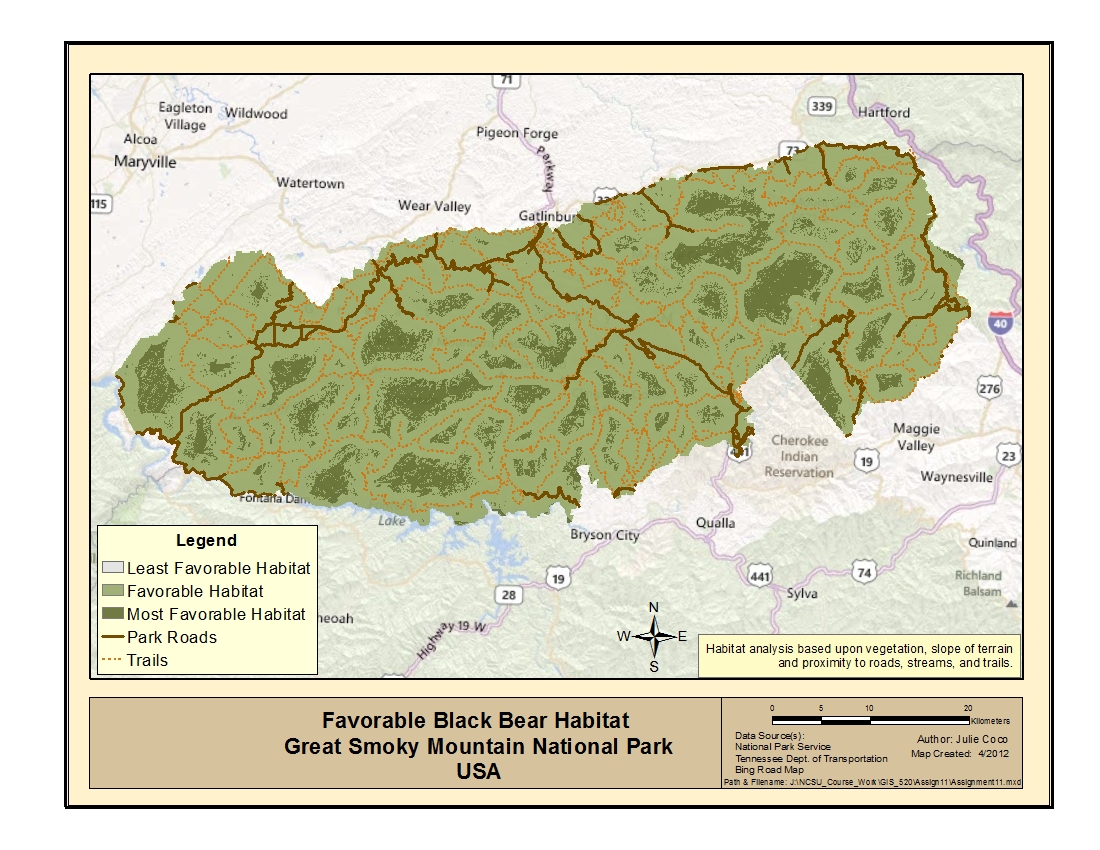
Click image to enlarge.
Application and Reflection
Weighted overlays using GIS could be used for finding and ranking suitable sites for many other situations. For instance, prime farmland can be initially determined based upon slope, soils, aspect, hours of sunshine, and/or solar radiation. Potential wetland mitigation sites can be determined using slope, soils, vegetation, zoning and rainfall data. Siting an amusement park could involve weighting factors such as population density, population age, distance to major freeways or urban areas, and land use/zoning.