
Linear Referencing
Learning Objective
To demonstrate an elementary understanding of linear referencing
Problem
Using provided linear referencing data of roads, accident data and pavement condition, the problem requires experimenting with linear features by adding route event tables and creating layers in ArcMap, identifying specific events along routes, and determining measurements along routes and between route events. Additionally, the problem requires determining a correlation between auto accidents and pavement conditions along the same route, where each of these event tables may have been independently compiled.
Analysis Procedures
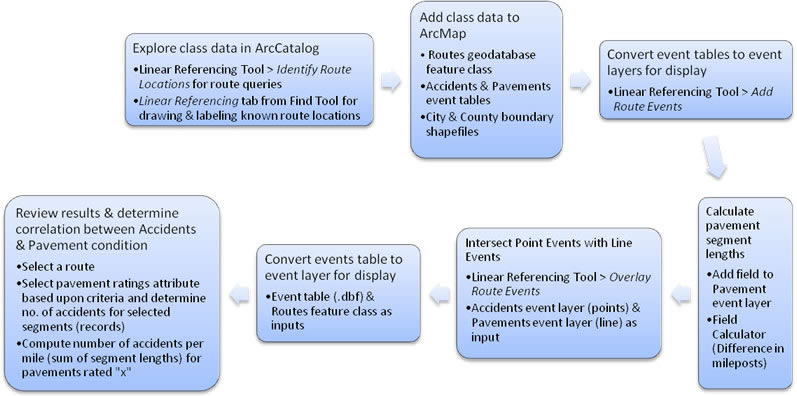
Linear referencing data containing geodatabase feature classes of a roads inventory with a route identifier field, of routes combined and composed from sets of the road features inventory, and of a subset of these routes were all added to a new ArcMap document using ArcGIS software. (The subset was used for this exercise.) The Identify tool in ArcCatalog was used to view attributes such as the number of routes, and to observe that routes are indeed, features. To identify routes as routes, the first Linear Referencing tool, Identify Route Locations, was used inside ArcMap after adding its button to the Tools toolbar. Clicking on a route using this tool provides information such as measurements, the number of parts to the route, and the direction of increasing measurement. The Linear Referencing tab of the Find tool allows for finding, drawing, or labeling a known event on a map. Accident and pavement event (i. e., pavement condition) tables were added within ArcMap. The Linear Referencing tool, Add Route Events was used to convert these two tables to point and line event layers, respectively for display. City and county boundary shapefiles were included for visual reference.
In order to determine a correlation between these different events, an overlay operation needed to be performed. Because the length of each pavement segment was unknown, a new field was added to the attribute table of the pavement events layer. A formula calculating lengths for each event using existing milepost measurements was compiled using the Field Calculator. The Linear Referencing tool, Overlay Route Events was then used to intersect the two event layers using a common route identifier. The two tables were combined to produce a new event table (.dbf) consisting of records of pavement event segments containing accident events. The graphic result displayed those accidents on pavement segments that occupy common space. This was accomplished once the event table was converted into an event layer using the Linear Referencing tool, Make Route Events Layer. The event table and routes subset feature class were used as inputs to this tool. From this operation, one can use attribute information such as pavement ratings along with the accident events along a route to determine the number of accidents per measurement (in this case, miles) on any selected route. For example, to know the number of accidents along a stretch of road with pavement ratings greater than 75, one could select a route with segments rated > 75, count the number of accidents (records in table), and then divide them by the sum of the segment lengths. This allowed for a correlation of accident frequency to pavement condition. The flowchart below illustrates the methods used.
Results
The map below shows the locations of auto accidents along certain selected routes in and around Pittsburgh, PA (Allegheny County).
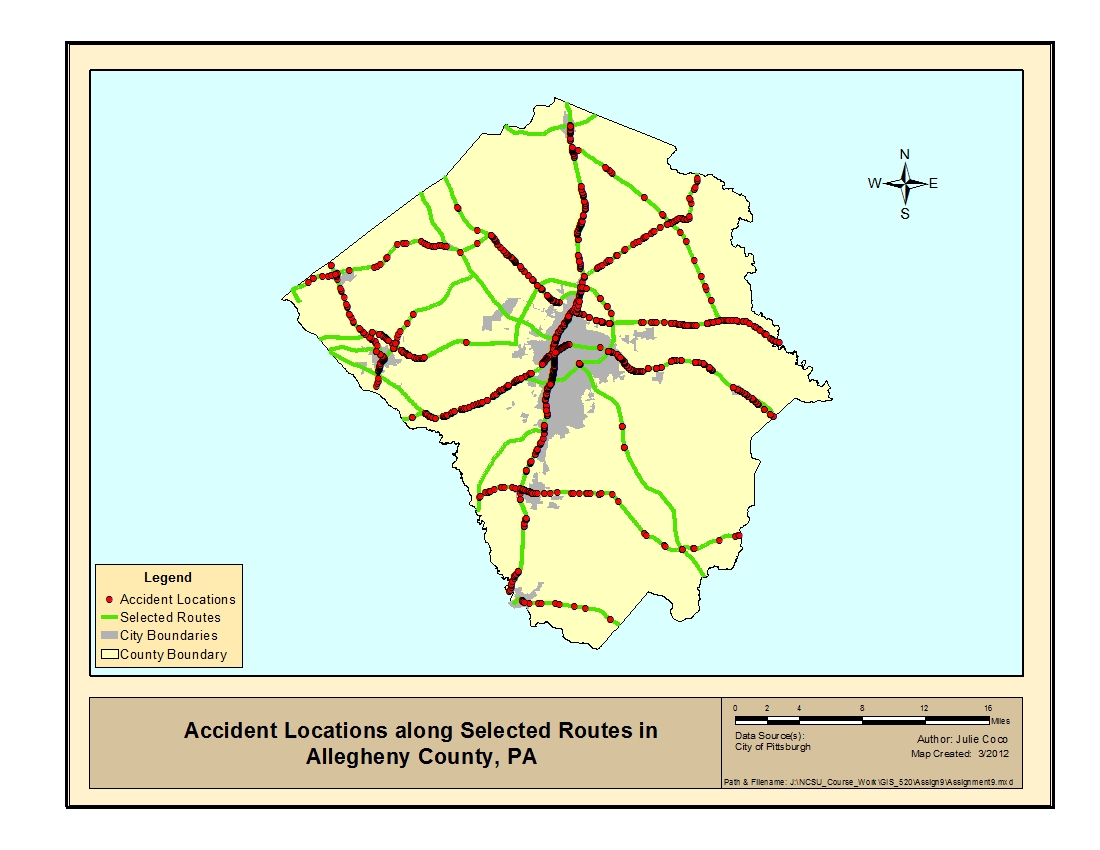
Click image to enlarge.
Application and Reflection
To expand upon the course notes, a river network represented by a single route feature class can have a point event table providing measurements for locations of stream gauges. In addition to a gauge identification number, the table could store discharge, or flow, measurements for each gauge. Discharge measurements at ungauged locations can be estimated, in part, from nearby gauged measurements. If a database of discharges at all locations along the main river of a watershed where contributing tributaries join was created to supplement the gauge measurements, it would greatly increase the estimation accuracy of flows needed for say, bridge modeling. At worst, it would provide quality assurance for flows calculated by ungauged methods. One limitation to this application might be database size. The scope of data creation may be limited to the geologic region or major river basin level.