
Turning Data Into Information Using ArcGIS
Module 1: Basics of Data and Information
Problem
The exercise objectives are to 1) display and compare four of the five types of geographic attribute data and their results, 2) to compare discrete objects and fields using data stored in vector and raster digital formats, and 3) to explore how sampled data can affect interpolation of surfaces. The last exercise in this module actually involves solving three problems using spatial analyst tools. The first problem is to determine residential parcels within a flood zone given land use and flood zone data. The second problem is to determine areas within a field that need pH treatment given random soil samples. The third problem involves determining the location of a new coffee shop from sales and distance data.
Analysis Procedures
ArcGIS for Desktop software was used along with data provided by ESRI, Inc. for use with these tutorials.
In order to compare the types of geographic data, attribute tables were provided from the tutorial data with each field in the table containing nominal, ordinal, interval and ratio attributes. To compare discrete objects versus fields, both vector and raster data were viewed within the same ArcMap document. Thirdly, the Inverse Distance Weighted interpolation method was used twice to create an elevation surface from two different sets of sample elevation points covering the same area in order to compare results.
To solve the first problem of Module1, a flood zone layer and a land use layer were added within an ArcMap document. The use of the Spatial Analyst, Logical tools enabled overlay operations to be performed determining residential areas that lie within the flood zone.
To solve the second problem of Module 1, a dataset of soil samples containing attributes of pH levels was interpolated using the Inverse Distance Weighted method across a farm field boundary layer to produce a pH surface. To determine areas that need treatment, the pH surface was queried by extracting only those cell values above “7” using the Spatial Analyst “Greater Than” tool.
To solve problem three of Module 1, a map of three layers containing shop and customer locations as well as a street map are used within ArcMap. A distance surface was created from the Shops layer using the Spatial Analyst “Euclidean Distance” tool. A density surface was then created from the Customers layer to determine areas covering the most customer spending over the previous year. The density surface was created using the Spatial Analyst “Kernel Density” tool. To determine the location of a new coffee shop from sales and distance data, a map algebra expression was used within the raster calculator specifying a minimum search radius from existing shops along with the Boolean operator “&” to also specify a minimum customer spending amount from the Density surface.
Results
Below are screen captures of some of the exercise results.
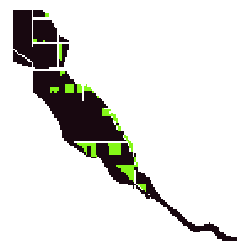
The above image represents residential areas (green) that lie within the flood zone outline (black).
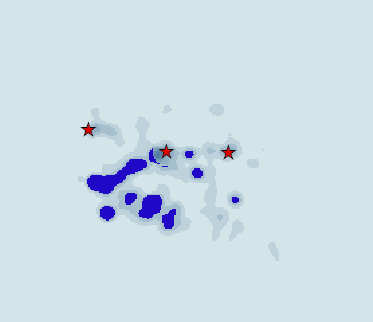
The above image represents a density map. The red stars represent existing coffee shop locations.
The dark blue areas have the greatest spending density of customers and are where the distance from an existing shop is greater than 1 mile.
The darker the color blue, the better the location for siting a new coffee shop.
Application and Reflection
Achieving the three objectives outlined above in Module 1, showed how to search for tools and data within ArcMap 10, instead of navigating through Toolbox. The interpolation exercise emphasized the importance of representative sampling. Interpolation using attributes such as elevation, can be used to create DEMs for floodplain modeling, for example. Targeting data of importance using samples and the Spatial Analyst tools can also aid in determining water bodies with poor pH levels for treatment, much the same way that the farmer could target his field for pH treatments.